Applying Sabermetrics to Any Business

Have you seen the movie Money Ball, starring Brad Pitt? The premise of the film was that one baseball team (Oakland A’s) made a decision to use advanced statistical analysis methods to best evaluate the capability for players to contribute to winning games. In 2002, the Oakland A’s had the third lowest team salary budget in the major leagues. Their only hope for success was to find undervalued players (read: low salary) that flew under the radar of other team scouts and managers.
Traditional player analysis previously focused primarily on very basic statistics like runs batted in (RBIs), home runs, batting average and stolen bases, as well as subjective judgements such as “he’s a hustler and a team leader”, “great player”, etc. Because that was always the way baseball teams evaluated players, it must be the best and only way, in their view. Even in this age of computer technology it is ironic that highly paid (and well regarded) scouts and managers still rely on simple statistics that were developed well before computers were even invented.
The analytical method used in Money Ball is something called sabermetrics, from the acronym SABR, which stands for the Society for American Baseball Research. The proponents of sabermetrics, consider measures that more directly relate to winning games, such as on-base % and slugging % (ranking hits based on whether they are singles, doubles, triples or home runs). For instance, it is entirely possible that a player with a high on-base % record but a low batting average will contribute more runs (and by extension more wins) than another player with a high batting average or even a high RBI count. In sabermetrics, one of the key factors is base runners, regardless of how they are generated. Player “star value” is simply not considered, and in fact is ranked negatively based on inflated salaries.
Sabermetrics goes beyond simple stats like player speed, to gauge the actual value of speed relative to winning games. Measures such as number of triples hit and successful stolen bases vs. caught stealing tell much more about the player’s ability to contribute to wins rather than clocking raw sprinting speed.
Another sabermetric example is something called Defensive Runs Saved (DRS). DRS tracks the number of runs a defensive player saved or cost their team on defense relative to a statistically average player. Therefore, rather than looking at the number of errors a player commits on average (a standard defensive metric), sabermetrics takes a closer look at whether those errors contributed to runs scored by the opposing team and conversely how many runs the player actually saved through strong defense.
Without computer technology, it would be difficult to collect and analyze this level of data. A single metric could potentially be calculated from many other statistics.
Take a look at the formula used to determine Batting Average With Balls In Play (BABIP).
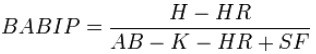
H=Hits, HR=Home Runs, AB=At Bats, K=Strikeouts, and SF=Sacrifice Flies
Imagine the 1919 New York Yankees attempting to analyze Babe Ruth’s BABIP before they bought him from Boston. Well that one worked out just fine, but many other potential Ruths never made it past the minor leagues, demonstrating that traditional player evaluation methods have always been imperfect at best.
The principles of sabermetrics can be applied to virtually any business. You may need to take a step back from your traditional analytical processes and consider new and innovative methods, even those that may seem to be far “out of the box”. But in 2002 and 2003, sabermetrics took an also-ran Oakland team to the playoffs, with a salary budget 1/3 of the Yankees. Now, virtually every major league baseball team uses sabermetrics to one degree or another and continues to try to find innovative ways to evaluate new and existing talent!
The greatest innovators in business are the ultimate winners. Your Money Ball is there. You just need to find it.