Combining HR Help Desk Data with External Data Sources
LBi HR Help Desk is known for its flexible reporting templates – more than 15 templates HR can access to build a wide array of powerful and productive custom reports. These templates in aggregate provide end users with access to virtually all of HR Help Desk’s data fields.
Using HR Help Desk’s export feature, data points may be combined from multiple templates to provide an even greater capability to build specialized reports and analytics. But what about merging data from non-HR Help Desk systems for literally limitless analytics capability?
Today, in many industries analytics is the name of the game for companies seeking a competitive edge. IT departments are often inundated with custom analytics requests from every department and business group. You want a custom report? Take a number. Don’t call us – we will call you.
So what can HR do to accelerate delivery of their custom report requests? This blog will demonstrate how to use Microsoft Excel and one single key function plus Pivot Tables to combine data from literally any source into a single table, ready to slice and dice.
That’s right. Specifically VLOOKUP and Pivot Tables together are the keys to HR analytics nirvana. Perfect? No. Limitless? No. But you will be amazed how easy and flexible it is to create a wide variety of reports using your help desk data combined with data from other sources.
Let’s say you want to analyze the demographics of employees that have submitted harassment or discrimination claims. You are primarily concerned about patterns of abuse by age, gender and/or race – neither of which is tracked in HR Help Desk. Additionally you want to analyze whether your recent diversity training was beneficial in reducing complaints.
Here are the basic data points and common location you need to create your reports:
| Data Field | Data Location |
| Employee ID (key field) | HRIS, Help Desk, Talent mgmt |
| Employee gender | HRIS |
| Employee race | HRIS |
| Employee age | HRIS |
| Date of complaint | Help Desk |
| Category of complaint (i.e. discrimination) | Help Desk |
| Date of diversity training | Talent mgmt |
Notice the key field must be included in each export table. This field ties all tables together.
Here are the steps you need to take:
- From each system (HRIS, Help Desk, Talent Mgmt) create an extract of the above fields and open in Excel. Place each table in the same workbook, each in separate worksheets.
- Highlight each table and create a name for each (i.e. HRIS_table, HD_table, TM_table). Make sure the Employee ID is the 1st column in each table.
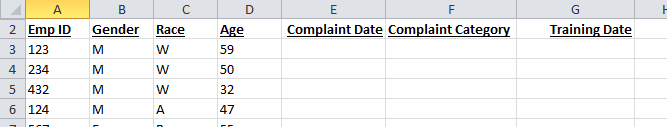
- Open the HRIS table and add the Complaint Date, Category, and Training date column headers. The table should look something like this:
- Now for the magic formula – =VLOOKUP(lookup cell, in this table, return this column value, false)
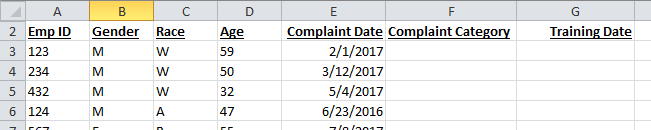
Enter this formula in cell E3: =vlookup(A3,HD_table,3,false) , where “3” is the HD_table column for the Complaint Date.
Copy this formula down to the last row. Your table should look like this:
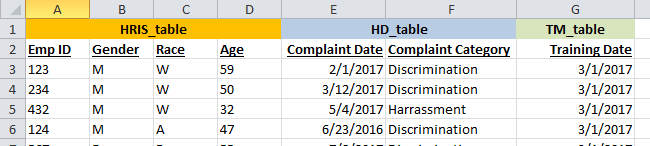
Now repeat these steps for the Category and Training Date columns. Now your table should look like this:
- Your table is now ready for pivot table analysis. Click anywhere in the table and select Pivot Table or chart from the Insert menu in Excel.
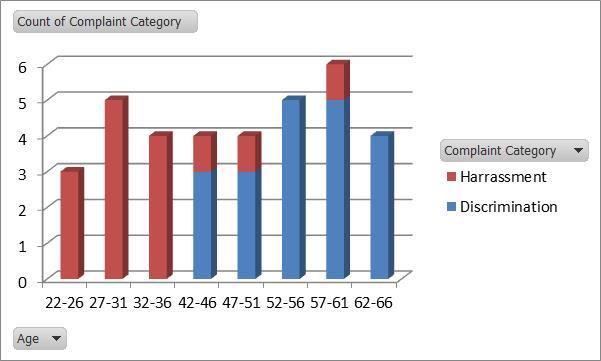
Below are just a few of the pivot table/chart analytics you can create in just a few mouse clicks:
Complaints by age range
Complaints by gender & race (Asian, Black, Hispanic, White)

Pre/Post Training Complaint Analysis

With a little practice you can easily create these and similar pivot charts in about 1 minute each. Since Excel is not a relational database, you must use VLOOKUP to “relate” or tie multiple tables together in order to use pivot tables and charts.
Not too much to ask, when real-time analytics are a necessity in HR. Your IT staff will be impressed.